Developing GunStat Benchmarks
The GunStat model can also be used to develop benchmarks to evaluate and monitor system conditions that impact gun violence. Benchmarks are measurements of data shared between partnering GunStat agencies that can help identify areas of progress—as well as obstacles and challenges—relating to interventions to disrupt gun offenders.
The GunStat coordinator should consider identifying and distributing benchmarks to help frame GunStat discussions in collaboration with partnering agencies. While the specific benchmarks used have varied across different cities implementing GunStat, measurements often include:
Trends related to the number, type, and location of guns recovered by police.
Incident and density mapping of gun violence within specific neighborhoods.
Year-to-year and month-to-month comparisons of gun violence and gun cases.
Clearance and prosecution rates for non-fatal shootings, homicides, and other gun-involved crimes.
Open warrants for gun-related offenses.
NIBIN leads and correlations.
Trends in bail and pre-trial confinement for gun offenders.
Federal adoption of gun cases.
Trends related to case outcomes and sentences for gun offenders.
Post-conviction monitoring of probation and parole outcomes for gun offenders.
Recidivism rates for gun offenders

Examples of GunStat Benchmarks
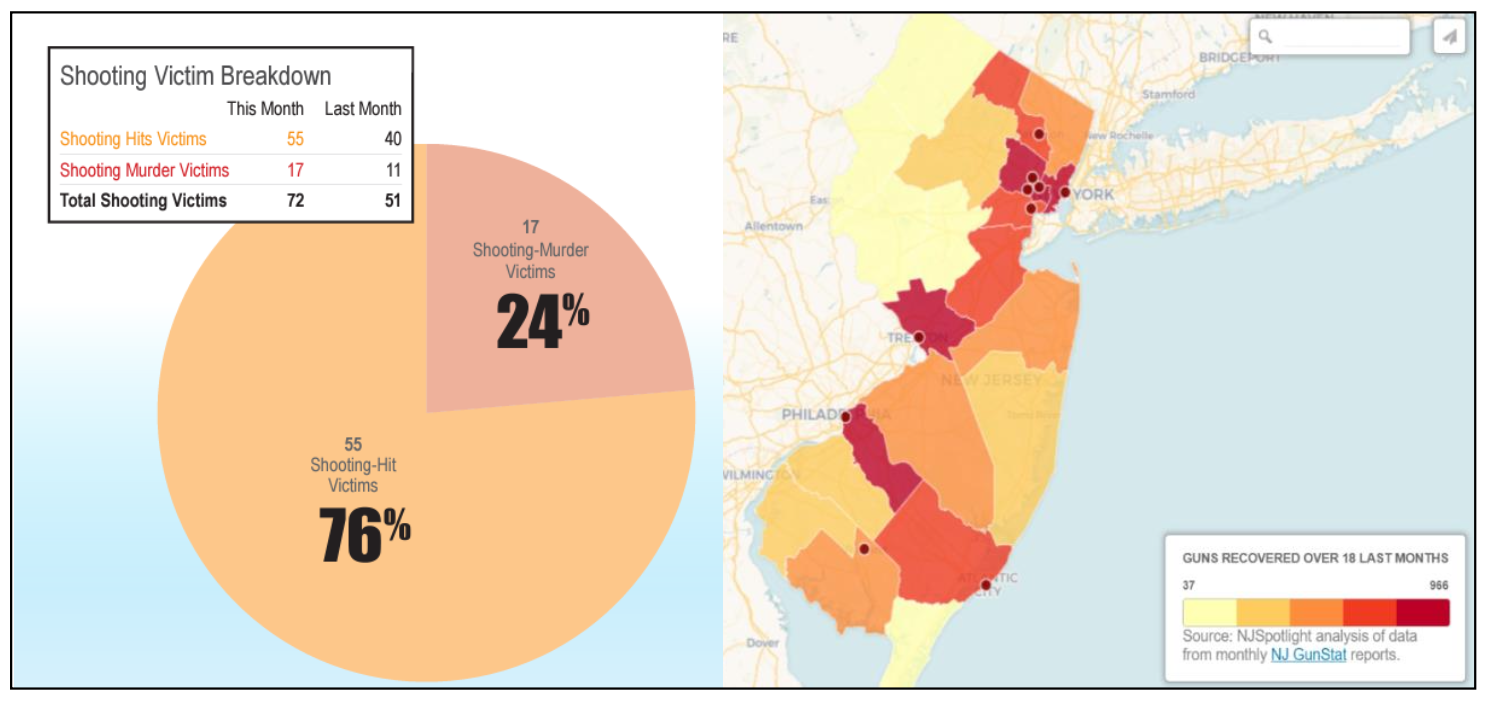
Figure 10: Examples of New Jersey GunStat benchmarks include tracking and mapping of gun cases
in the state and analysis of guns recovered by police.
New Jersey: In 2018, the state of New Jersey began using a GunStat process to track and examine trends in gun violence statewide. The process is managed in partnership with the Governor’s Department of Law and Public Safety and the New Jersey State Police (NJSP). Benchmarks include monthly reports that analyze the number and types of guns recovered in counties and cities within the state, along with detailed information on individuals arrested for gun crimes. Quarterly GunStat reports are made available to the public on a website managed by NJSP.iii
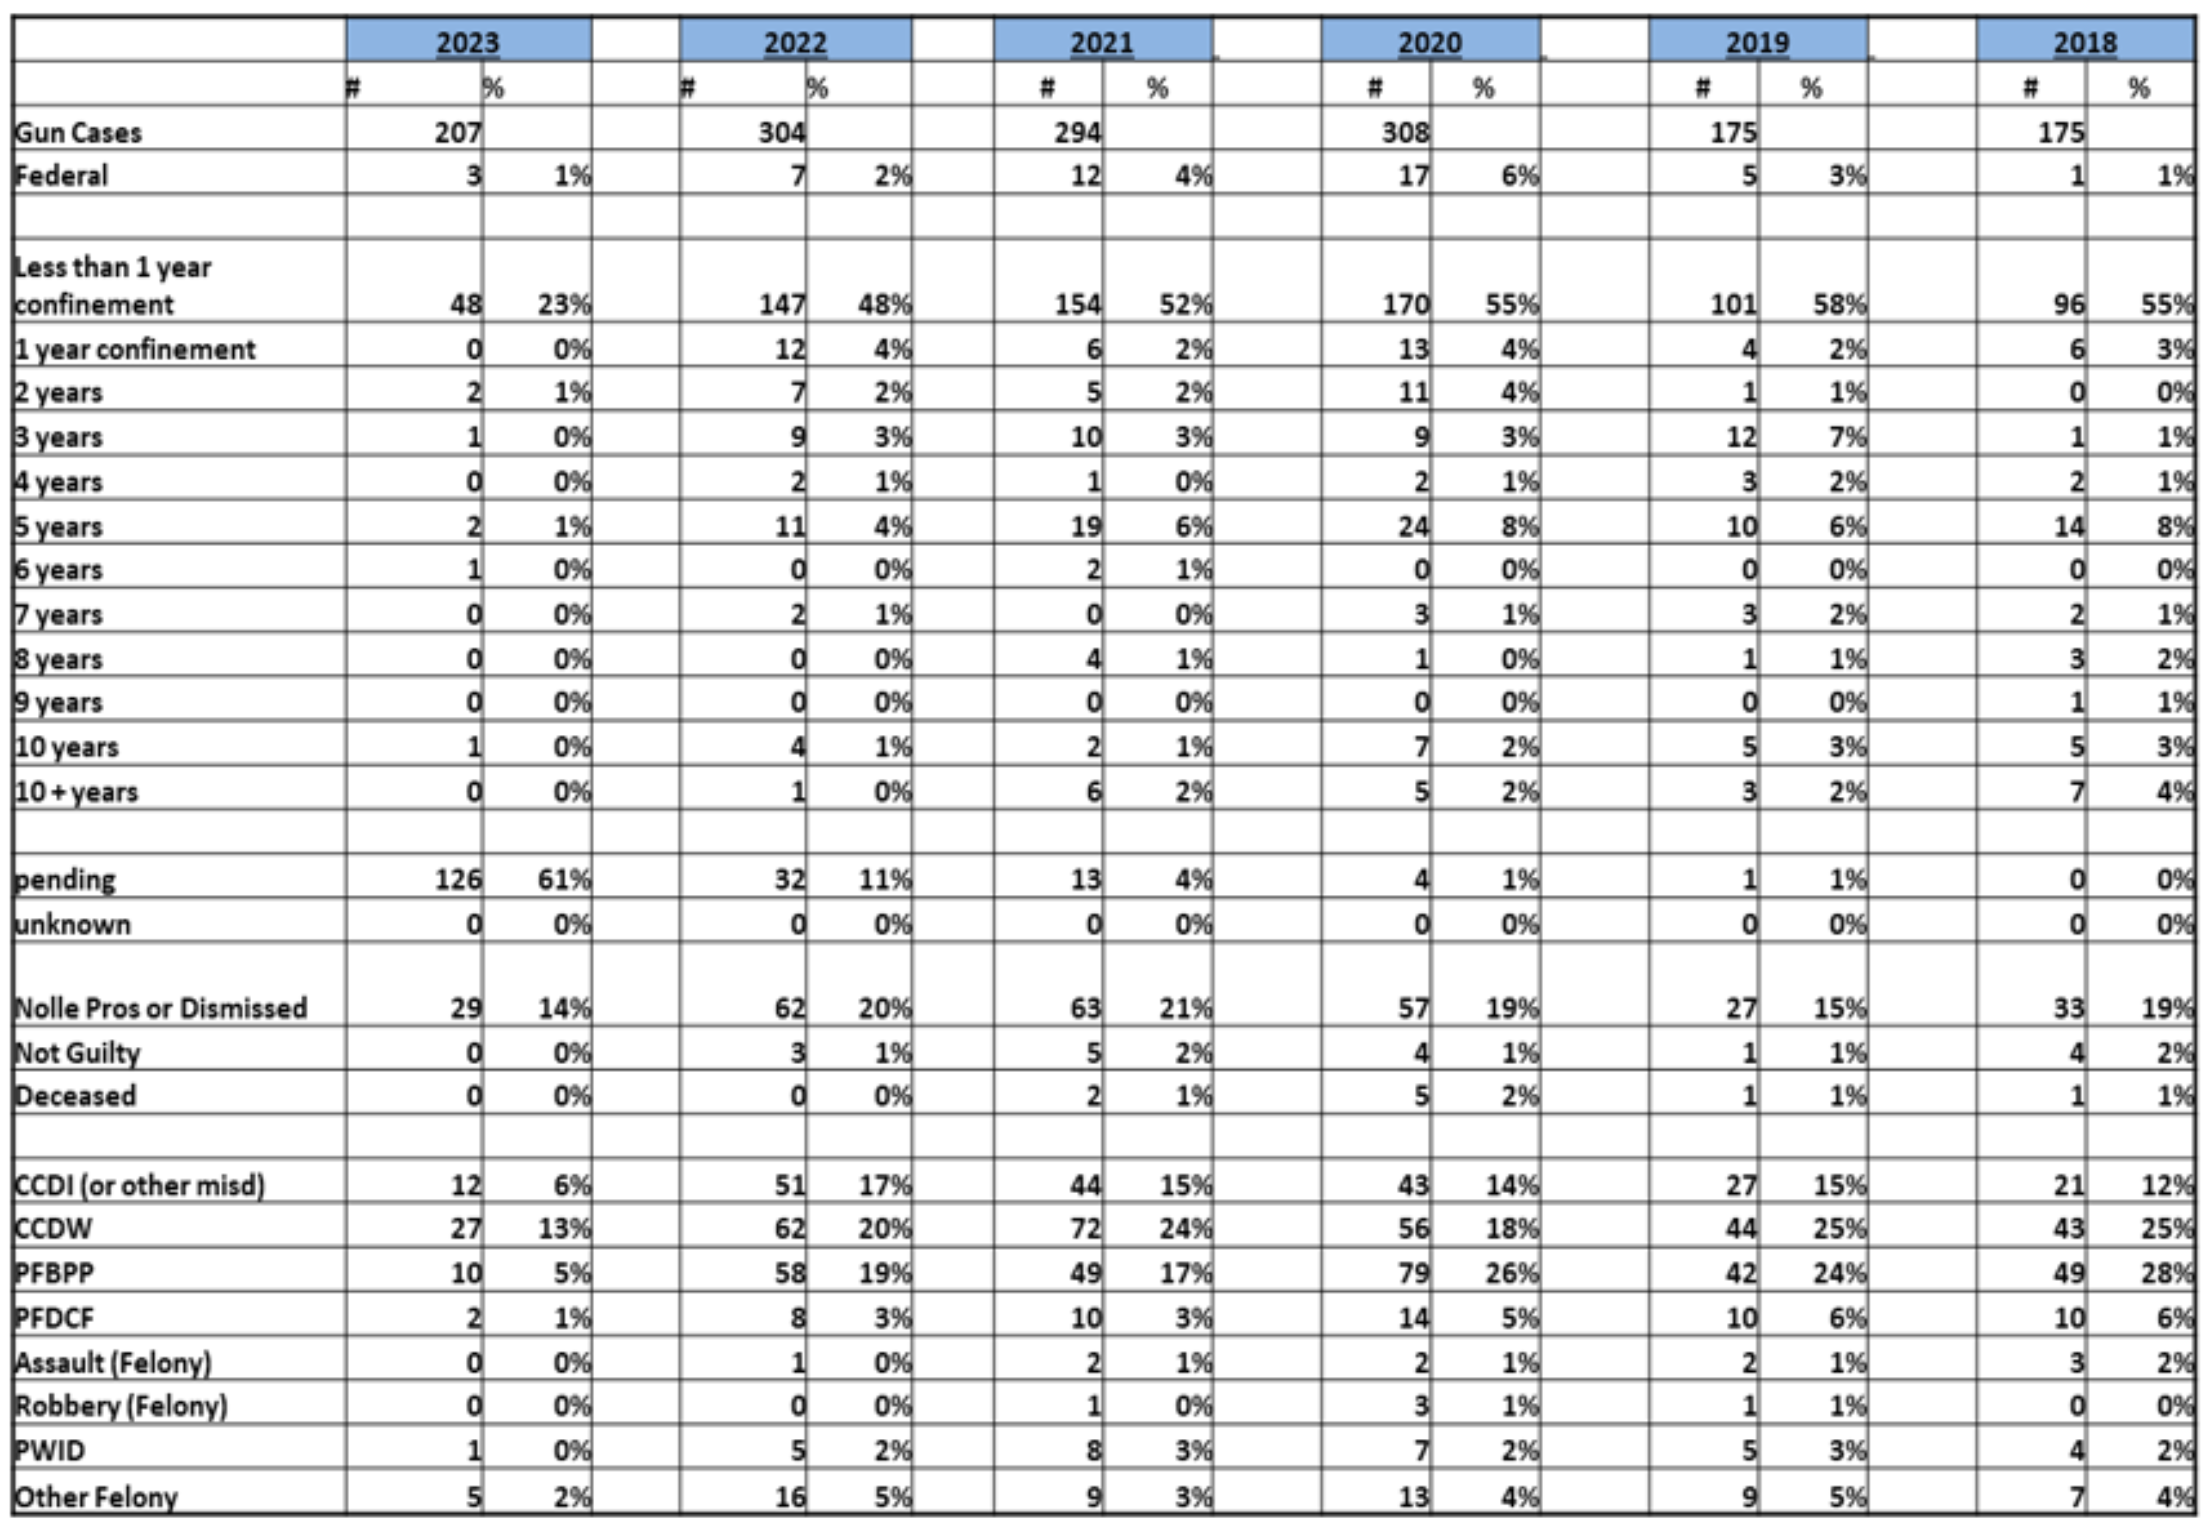
Figure 9: Example of Wilmington outcome benchmarks for gun cases.
Wilmington, Delaware: The Wilmington GunStat process uses a variety of benchmarks to monitor and evaluate the dispositions in gun cases. The benchmarks are distributed to all GunStat agencies in an outcome spreadsheet.

Fig. 8: Examples of Philadelphia GunStat benchmarks identifying high violence zones and using heat mapping to track trends in violent crime.
In 2012, Philadelphia implemented a GunStat model that was coordinated jointly by the police department and the district attorney’s office. The program centered on identifying prolific gun offenders in specific neighborhoods. Strategies included the identification of locations with a high incidence of violent crime and the disruption of gun offenders in these locations with enhanced enforcement, intervention, and prevention strategies.i Philadelphia used benchmarks that incorporated mapping and trend analysis of violent crimes, as well as a wide range of data that tracked case outcomes.ii
Works Cited:
i Sorg, E. T. (2015). An ex post facto evaluation of the Philadelphia GunStat model [Doctoral dissertation]. Temple University. https://scholarshare.temple.edu/handle/20.500.12613/3594
ii McGlynn, C. (2013). Aiming carefully: GunStat. [PowerPoint slides]. SlidePlayer. Philadelphia District Attorney’s Office. https://slideplayer.com/slide/10448264/
iii New Jersey State Police (2024, March 11). NJ GUNSTAT. https://www.nj.gov/njsp/njgunstat/index.shtml